Projects
A curation of data science initiatives

Forecasting 2026 Blue Jays Attendance: A Data-Driven Approach Using MLB StatsAPI
How many Blue Jays fans will pack the stadium this year? By analyzing a comprehensive dataset spanning 2015 to 2025 via the MLB StatsAPI, this study forecasts game-by-game attendance for the 2026 Blue Jays season to help optimize stadium operations and marketing strategies.

Do 'Loonie Dogs' Nights Actually Drive Attendance? A Difference-in-Differences Causal Analysis
This study applies a Difference-in-Differences (DiD) framework to estimate the true causal impact of "Loonie Dogs" promotions on game-day attendance for the Blue Jays. By comparing attendance trends on promotion days (the treatment group) against a comparable control group of non-promotional games, this analysis isolates the structural lift in ticket sales from confounding variables like seasonal demand and day-of-the-week effects.
A/B Testing the 'Bobblehead Effect' on Blue Jays Attendance
Utilizing historical game-level data, this study applies A/B testing methodologies using Python to quantify the impact of bobblehead promotions. The analysis evaluates whether these giveaway events generate a statistically significant increase in Blue Jays attendance, providing data-driven insights into the efficacy of the team's promotional budget.

Blue Jays Fan Demand & Event Segmentation: A K-Means Clustering Approach
This project applies K-Means clustering to historical Toronto Blue Jays data to segment and profile game-day dynamics at the Rogers Centre. By grouping games based on multivariate features—including attendance metrics, opponent profiles, stadium capacity, and promotional schedules—this analysis uncovers distinct operational clusters that help optimize ticketing strategies and fan engagement campaigns.
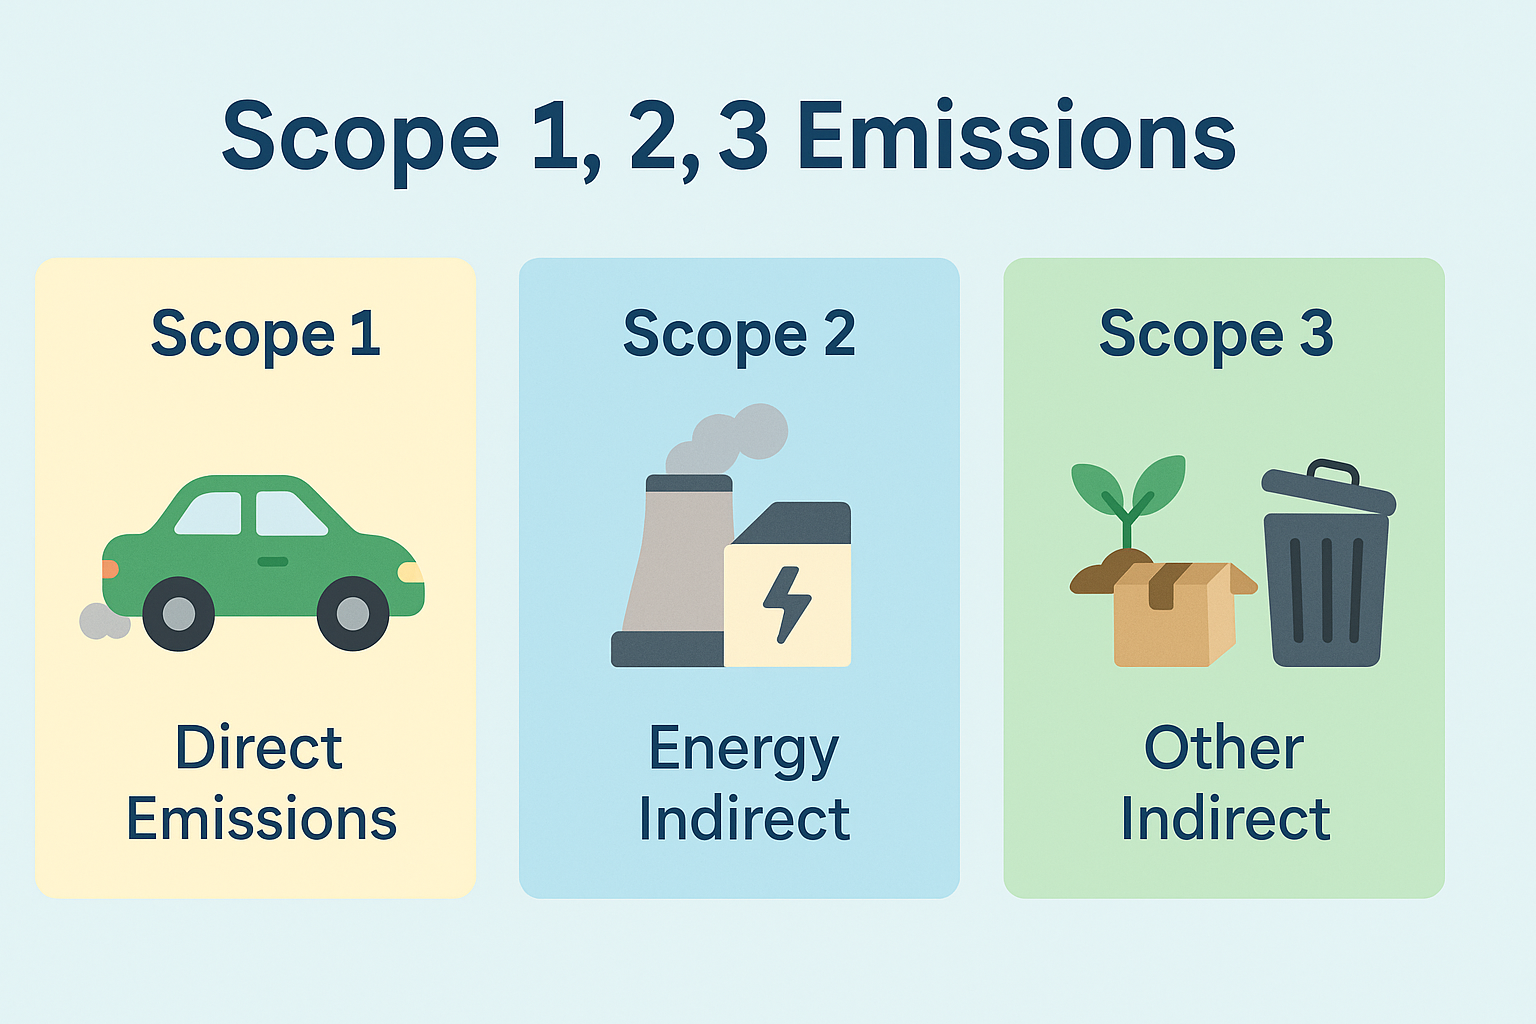
Scope 3 Emissions Dashboard
Ranking automotive manufacturers against their scope 3 emissions. This is an example of an end to end lifecycle of an analytics project. Includes conversion of PDFs into vectors for use in a vector database, Claude for table extraction, Databricks using the Medallion architecture for ETL, and Power BI for the final deliverable.