
Why rank companies based on Scope 3 emissions?
Why Scope 3 Rankings Matter for Investment
- Uncovering Hidden Risks: Scope 3 emissions cover indirect upstream and downstream activities—such as supply chains, transportation, and product use. These often make up over 70% to 90% of a company's total carbon footprint. Ignoring them leaves major financial and regulatory blind spots.
- Exposing Transition Vulnerabilities: Companies that rely on high-emission suppliers or produce polluting products face future carbon taxes, regulatory penalties, and shifting consumer demands. Ranking highlights which firms are most exposed to these transition costs.
- Testing Climate Commitments: Many companies make net-zero promises, but only transparent Scope 3 data shows whether they are actively cleaning up their supply chains or just greenwashing their direct operations.
- Guiding Capital Allocation: Institutional investors use these rankings to direct capital toward industry leaders who innovate and decarbonize their entire ecosystems, lowering long-term portfolio risk.
Rankings
The following rankings are based off data extracted from Annual Reports and Sustainability Reports.
Fig 1.1:
Scope 3 Emission Rankings
Click on the bottom right of the graph for a fullscreen view.
Notes
With ESG Data, not every company releases their data at the same time so we might not always have the data for all companies.
Methodology
All companies are ranked across the different 15 Scope 3 Categories.
If the company does not disclose a figure, it is assigned 1 below the lowest score. For example, if the lowest ranking
for Category 1 is 9, then non-disclosures are assigned a score of 10.
Takeaways
Most companies are close in score. Porsche has a poor ranking and that is to be expected as performance parts don't enjoy economies of scale. Mazda and Jaguar Land Rover have poor rankings due to non-disclosures. The figures have been normalized through tco2e/vehicle since brands like VW are extremely high volume manufacturers (approx 9 million vehicles), whereas Porsche only produces approx 300k vehicles a year.
Databricks
Implementation of Medallion architecture
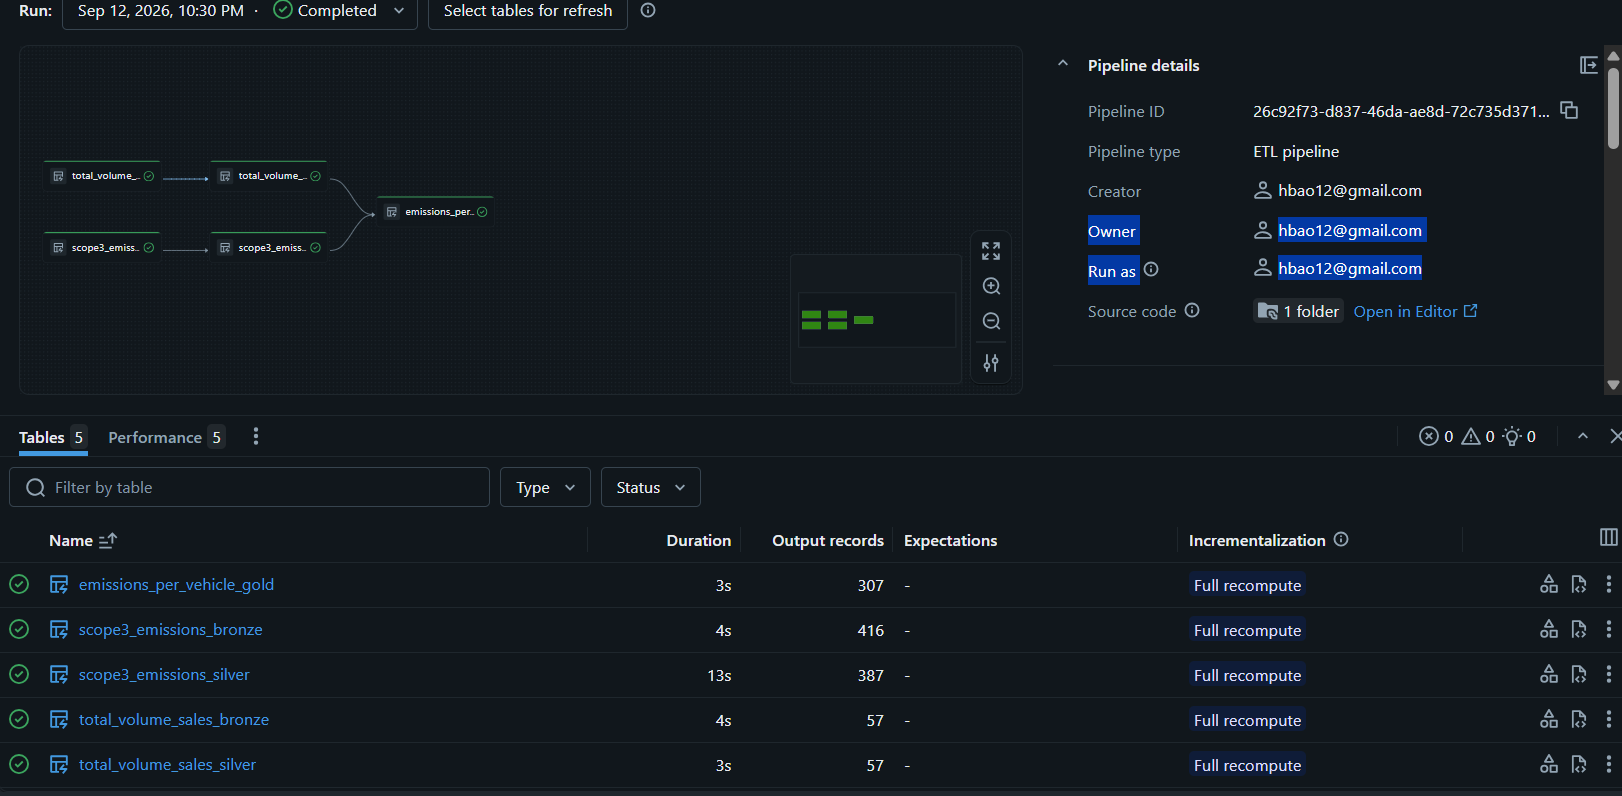
Fig 1.2:
Databricks architecture.
Click image for fullscreen view.
Tech Stack