
Customer segmentation is the strategic process of dividing a customer base into groups sharing similar characteristics—such as demographics, behaviors, or needs—to enable targeted marketing, improved retention, and higher ROI. We can achieve this through cluster analysis, where we group similar data points together.
Using a dataset provided by Walmart, that contains anonymous purchase data from an anonymous store, we will attempt to create different clusters, which will represent different customer profiles, based on the purchase data.
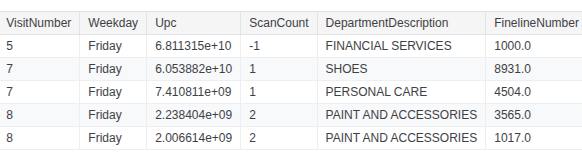
Fig 1.1: Sample of dataset provided by Walmart.
Interpreting the raw data
We have the following data field information provided by Walmart:
- ○ VisitNumber - an id corresponding to a single trip by a single customer
- ○ Weekday - the weekday of the trip
- ○ Upc - the UPC number of the product purchased
- ○ ScanCount - the number of the given item that was purchased. A negative value indicates a product return.
- ○ DepartmentDescription - a high-level description of the item's department
- ○ FinelineNumber - a more refined category for each of the products, created by Walmart
We will ignore the FineLineNumber and Upc fields, as they are not relevant in our analysis.
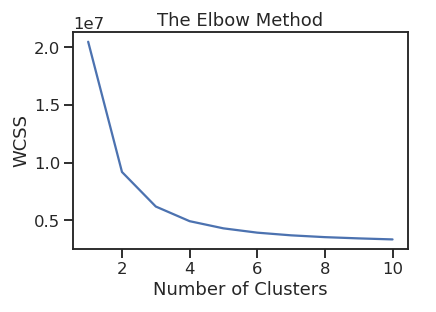
Fig 1.2: The elbow method suggests that the optimal number of clusters is 3.
Analyzing the clustered data
After applying the K-Means Clustering algoirthm and analyzing the clusters with respect to the fields: Weekday, ScanCount, and DepartmentDescription, we arrive at the following:
| Cluster ID | By Weekday | By ScanCount | Top 5 Department |
|---|---|---|---|
| 0 | Slight preference for weekend | 10-32 items per visit |
|
| 1 | Indifferent | 1-10 items per visit |
|
| 2 | Strong preference for weekend | 32-100+ items per visit |
|
Table 1.1: Cluster analysis amongst the different fields
Building the profile
Based on the cluster analysis, here are the final customer profiles
| Cluster ID | Customer Profile |
|---|---|
| 0 | Smaller household without children, due to the lower item count per visit. |
| 1 | Individuals who only need a couple of items, who are more inclined towards impulse merchandise. |
| 2 | Larger household, due to the higher item count per visit. |
Bonus Insights Content
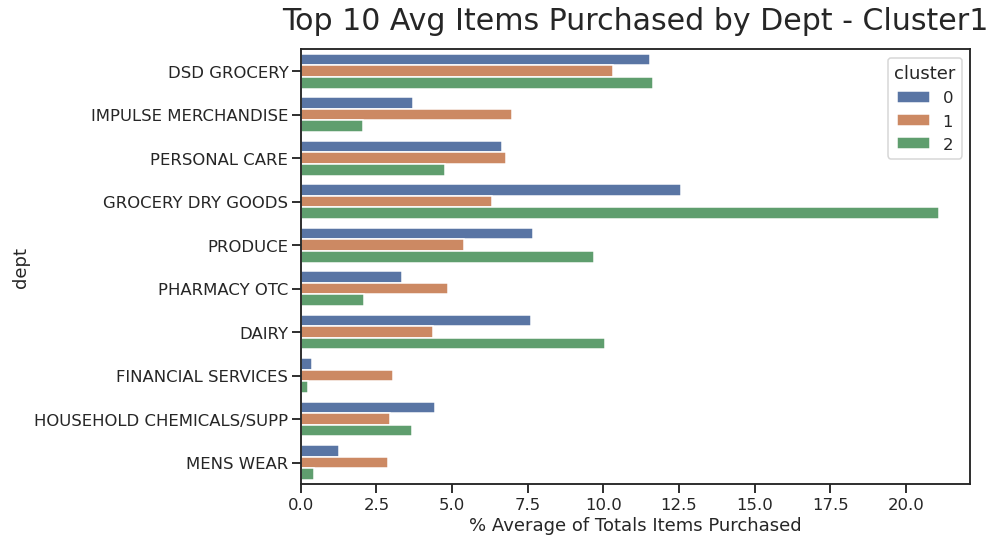
Fig 1.3: The customer profile associated with Cluster 1 has a stronger preference for Impulse Merchandise, Men's Wear and Financial Services, compared to the other 2 customer profiles.